
Case study · E-commerce
My Sneaker Studio: ₹8.68 lakh of tracked purchases on ₹67,631 of Meta spend in March 2026
Footwear D2C brand. Meta Ads. Window: February and March 2026 (ad-level views).
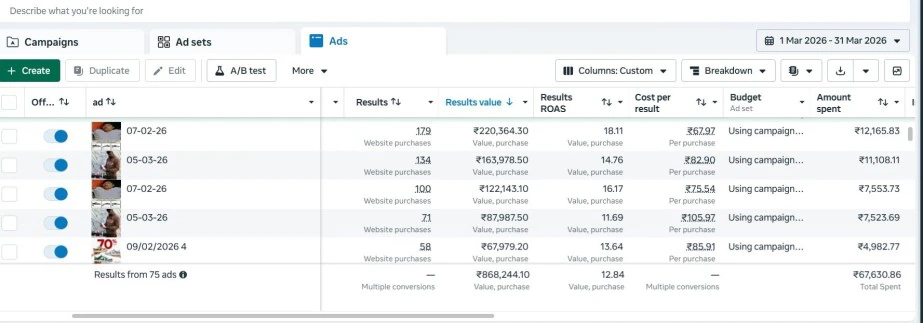
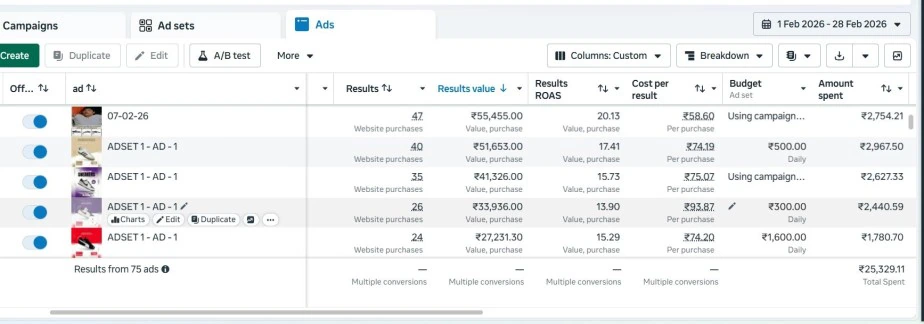
In March 2026, My Sneaker Studio’s Meta account shows ₹8,68,244 of purchase value on ₹67,631 of ad spend, a blended return on ad spend (ROAS) of 12.84, as Meta reports it. Spend rose from ₹25,329 in February to ₹67,631 in March. The best single ad in February reached a ROAS of 20.13 on ₹2,754 of spend.
- 12.84blended ROAS in March 2026₹8.68L purchase value ÷ ₹67,631 spend
- 20.13ROAS of the best single ad, February47 purchases · ₹2,754.21 spent
- 2.7×spend growth, February to March₹25,329 → ₹67,631
- 179purchases from the top March adROAS 18.11 · ₹67.97 per purchase
- Client
- My Sneaker Studio, footwear D2C brand
- Industry
- E-commerce
- Channel
- Meta Ads (Facebook and Instagram), purchase campaigns
- Result optimised for
- Website purchases
- March 2026
- ₹67,630.86 spend → ₹8,68,244.10 purchase value
- February 2026
- ₹25,329.11 spend
- What we manage
- Campaign structure, creative testing and weekly optimisation
What My Sneaker Studio needed.
My Sneaker Studio needed to scale online footwear sales profitably: customer acquisition cost was rising, catalogue visibility was low and repeat purchases were few.
What the screenshots show.
Two ad-level screenshots (75 ads each) show how the account is run.
- Creative is tracked in dated batches. The top ads carry dates in their names (“07-02-26”, “09/02/2026”, “05-03-26”), which is how we keep track of each batch. March’s top five include ads dated 7 Feb, 9 Feb and 5 Mar, so new creative reaches the account every few weeks.
- Purchases are the result. Every row optimises for website purchases and reports purchase value, which is how ROAS is read.
- A wide spread of ads. 75 ads were live in each month, and the top five carry most of the value.
- Spend scaled while ROAS held up. Spend rose 2.7× from February to March, and the March top ads still ran between ROAS 11.69 and 18.11.
The numbers, row by row.
Each row names its definition and the screenshot it comes from.
My Sneaker Studio results ledger
Read from the screenshots below
| Measure | Value | How it is defined | Evidence |
|---|---|---|---|
| March 2026 spend | ₹67,630.86 | Amount spent, 75 ads, 1–31 Mar 2026 | Screenshot 1 |
| March 2026 purchase value | ₹8,68,244.10 | Results value (website purchases), Meta-reported | Screenshot 1 |
| March 2026 blended ROAS | 12.84 | Computed check: ₹8,68,244.10 ÷ ₹67,630.86 = 12.84 | Screenshot 1 |
| Top March ad | 179 purchases · ROAS 18.11 | ₹2,20,364.30 value on ₹12,165.83 spent; ₹67.97 per purchase | Screenshot 1 |
| February 2026 spend | ₹25,329.11 | Amount spent, 75 ads, 1–28 Feb 2026 | Screenshot 2 |
| Best single ad, February | ROAS 20.13 | 47 purchases, ₹55,455.00 value on ₹2,754.21 spent; ₹58.60 per purchase | Screenshot 2 |
| Spend growth | 2.67× | March spend ÷ February spend (computed) | Screenshots 1–2 |
Results come from a real client account and vary by business, offer, budget and market. They are not a guarantee of what you will get.
What did not work.
A case study that shows only the winners is an advert. These are the misses.
- The 20× is a single ad, not the account. ROAS of 20.13 belongs to one ad that spent ₹2,754.21. The blended ROAS for the month in which spend was highest is 12.84. We lead with the blended figure.
- Ads fade. The weakest of the top five March ads ran at ROAS 11.69 and ₹105.97 per purchase, against ROAS 18.11 and ₹67.97 for the best. A creative that wins one week needs a replacement already in testing.
- Meta-reported value is not store revenue. “Purchase value” is what Meta attributes to the ads. It can differ from the store’s own sales report. We do not publish store revenue until the matching store export is on file.
What we would do next.
- Attach the store’s own sales export for the same months, so the Meta figure and the store figure sit side by side.
- Add the February blended ROAS (total purchase value is not visible in the February screenshot).
- Keep a test slot for new creative every fortnight, and retire ads when their ROAS falls below break-even.
2 screenshots, as captured.
Open any image full size. Under each one is a text version of the rows we used.
Read this screenshot as text
| Ad | Purchases | Purchase value | ROAS | Cost per purchase | Spent |
|---|---|---|---|---|---|
| 07-02-26 | 179 | ₹2,20,364.30 | 18.11 | ₹67.97 | ₹12,165.83 |
| 05-03-26 | 134 | ₹1,63,978.50 | 14.76 | ₹82.90 | ₹11,108.11 |
| 07-02-26 (2) | 100 | ₹1,22,143.10 | 16.17 | ₹75.54 | ₹7,553.73 |
| 05-03-26 (2) | 71 | ₹87,987.50 | 11.69 | ₹105.97 | ₹7,523.69 |
| 09/02/2026 4 | 58 | ₹67,979.20 | 13.64 | ₹85.91 | ₹4,982.77 |
Transcribed from the image above for readers who cannot zoom. The image is the evidence; the table is a reading aid.
Read this screenshot as text
| Ad | Purchases | Purchase value | ROAS | Cost per purchase | Spent |
|---|---|---|---|---|---|
| 07-02-26 | 47 | ₹55,455.00 | 20.13 | ₹58.60 | ₹2,754.21 |
| ADSET 1 – AD – 1 (a) | 40 | ₹51,653.00 | 17.41 | ₹74.19 | ₹2,967.50 |
| ADSET 1 – AD – 1 (b) | 35 | ₹41,326.00 | 15.73 | ₹75.07 | ₹2,627.33 |
| ADSET 1 – AD – 1 (c) | 26 | ₹33,936.00 | 13.90 | ₹93.87 | ₹2,440.59 |
| ADSET 1 – AD – 1 (d) | 24 | ₹27,231.30 | 15.29 | ₹74.20 | ₹1,780.70 |
Transcribed from the image above for readers who cannot zoom. The image is the evidence; the table is a reading aid.
Questions about the My Sneaker Studio results
Return on ad spend is purchase value divided by ad spend. A ROAS of 12.84 means ₹12.84 of purchases are attributed to every ₹1 spent on ads, before product cost, shipping, returns and fees.
No. It is the purchase value Meta attributes to the ads. Store revenue can be higher or lower, and profit depends on margin and returns.
The 20.13 ROAS belongs to one ad in February. March’s 12.84 is the blended figure for 75 ads and ₹67,631 of spend, which is the number a business owner should plan around.
No. ROAS depends on your margin, price, creative, audience and how well the site converts. We can read your account and tell you honestly what is realistic.
Keep reading
Free · No obligation
Want results like My Sneaker Studio’s for your business?
Tell us about your business in under a minute. We review your ad account, tracking and funnel and send a written snapshot with three quick wins.
Start with two quick questions
Step 2 is optional.
Thanks, . You’re in.
We reply within 15–30 minutes in business hours. To make the snapshot sharper, have these ready: read-only access to your ad account, your website link and your last 90 days of results.
- You tell us about your businessName, WhatsApp number and business type. About 40 seconds.
- We review and write it upAd account, tracking, creatives, landing page and lead handling, within 48 hours.
- We walk you through itA short call. Hire us or don’t: the snapshot is yours either way.
- Month-to-month, no long lock-in
- You own your ad account, Pixel and data
- Weekly report + 30-minute review
- We reply within 15–30 minutes in business hours